Dashboard
The dashboard is the landing page of the DCM user interface. It provides the user with all the necessary information about the server and its registered endpoints. It is conveniently structured in multiple tiles which convey the most useful information in one spot.
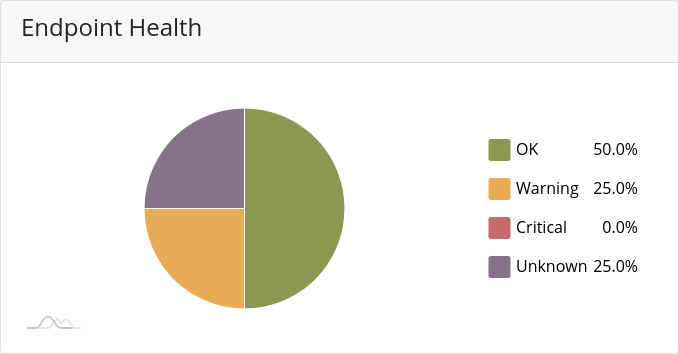
Device Health
The Endpoint Health tile utilizes a pie chart in order to quickly present the user with the health status of all endpoints under his licenses. The pie chart is interactable, which means it will respond to mouse hover and click events.
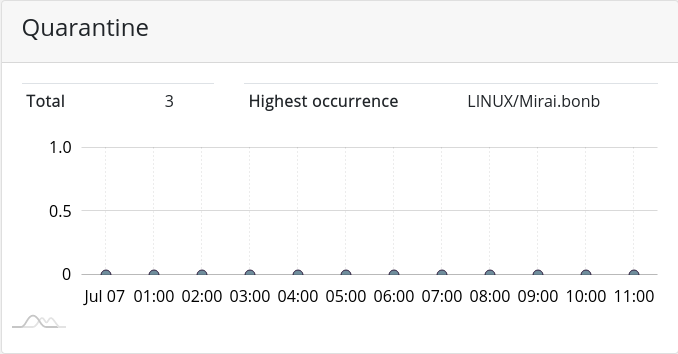
Quarantine
The Quarantine tile presents the current status of all quarantine findings of the last 12 hours. It also shows the total number of files in quarantine and the highest occurring finding.
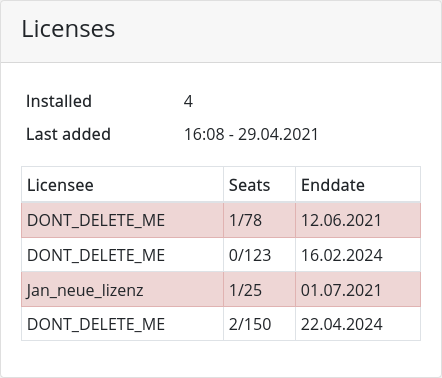
Licenses
The License tile provides quick information about the current status of all installed licenses. The most important information, the expiration date and the number of free seats are displayed in a table, with licenses about to expire highlighted in orange and licenses that have already expired highlighted in red.
Endpoint Version
The Endpoint Version tile provides a quick overview over deployed PRO ENDPOINT versions.

Running Scans
The Running Scans tile shows a accumulative view of all the running scans on all PRO ENDPOINT installations.

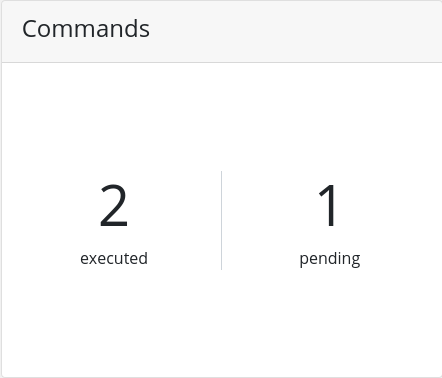
Commands
The Commands tile represents the internal workflow between DCM and PRO ENDPOINT. Since the infrastructure works asynchronous it might be useful to know how much commands might be still in process by the PRO ENDPOINT instances.
Virus Definition Files
The tile represents the versions of the Virus Definition Files. Latest Remote version is the most recent version. Latest Local version shows the current version available on your DCM. the Deployed table shows the VDF versions of your devices.